Scratch smarter,
not harder.
Every scratch-off is a bet against the house. We pull official prize data daily and rank 2,613 games by expected return — so you know which tickets are actually worth scratching before you spend a dime.
Is your favorite game already dead?
Right now 360 scratch-off gamesare still on shelves after every advertised top prize was claimed — the jackpot on the front can no longer be won, and the ticket won’t tell you. Check the dead tickets list →
We read what nobody reads
Every day we pull each state's official prize-claim data — the tables and PDFs almost no player ever opens.
We do the math
Every game gets a live expected return: how much of each dollar comes back, based on prizes still unclaimed.
You check before you buy
Thirty seconds on your state's page tells you which tickets hold value — and which are already tapped out.
We collect prize data from official state lottery websites every day and calculate the expected return of every scratch-off game we can — how much, on average, a ticket returns per dollar spent based on the prizes still unclaimed. Currently tracking 2,613 active games across 40 states · last updated Sep 15, 2026.
Even the “best” scratch-off almost always returns less than $1 per $1 played. These rankings tell you which games are less bad, not which games are profitable. Play for fun, not for income.
Today’s top 10 by expected return
| # | Game | State | Price | Return / $1 | Odds to Win | Top Prize | Est. Tickets Left | Prize Tiers Left |
|---|---|---|---|---|---|---|---|---|
| 1 |  300X#404 300X#404 | Massachusetts | $30 | $4.59 / $1 | 1 in 2.77 | $15,000,000 | 135,694 | 12/13 |
| 2 |  Fabulous Fortune#340 Fabulous Fortune#340 | Massachusetts | $10 | $2.08 / $1 | 1 in 3.48 | $4,000,000 | 268,064 | 12/13 |
| 3 |  BONUS 50X#444 BONUS 50X#444 | Massachusetts | $5 | $1.82 / $1 | 1 in 4.14 | $1,000,000 | 297,198 | 11/11 |
| 4 | Massachusetts | $10 | $1.67 / $1 | 1 in 3.26 | $2,000,000 | 148,975 | 14/15 | |
| 5 | 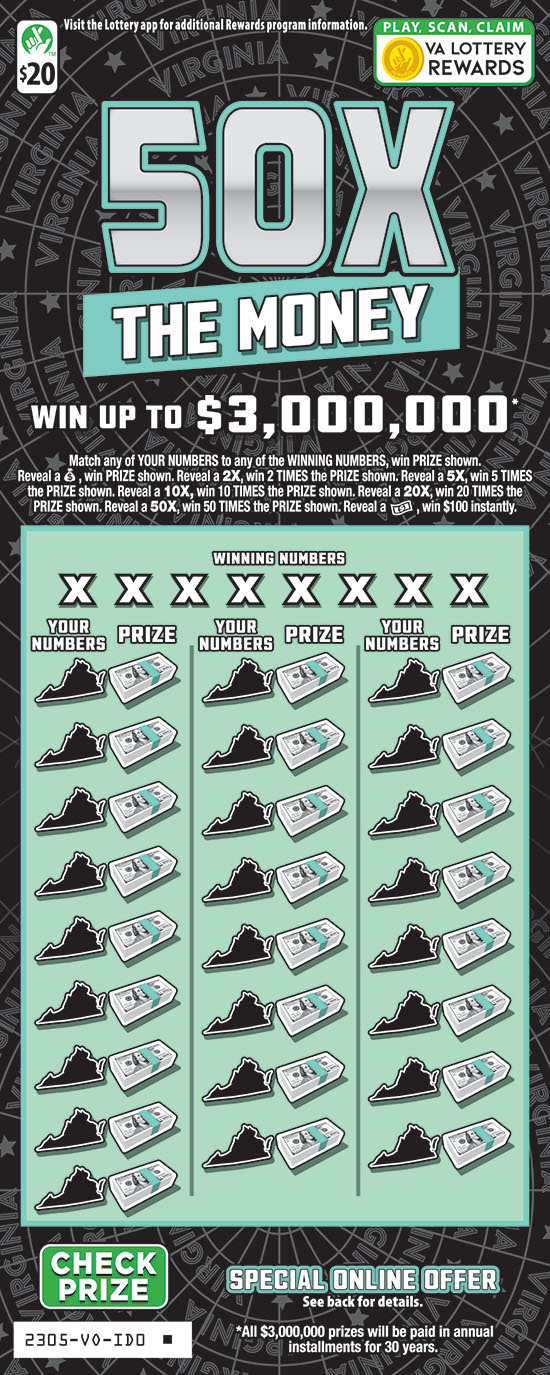 50X The Money#2305 50X The Money#2305 | Virginia | $20 | $1.49 / $1 | 1 in 3.03 | $3,000,000 | 370,048 | 11/12 |
| 6 | Massachusetts | $10 | $1.32 / $1 | 1 in 4.79 | $4,000,000 | 1,502,388 | 9/9 | |
| 7 | 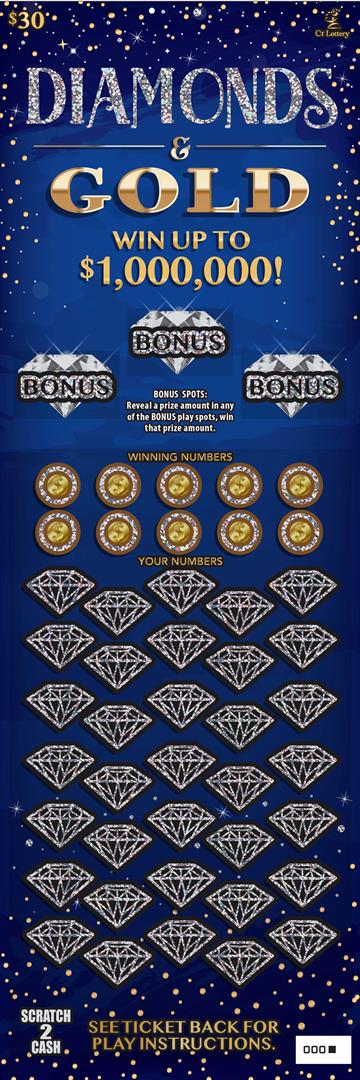 DIAMONDS & GOLD#1677 DIAMONDS & GOLD#1677 | Connecticut | $30 | $1.28 / $1 | 1 in 2.98 | $1,000,000 | 67,642 | 9/9 |
| 8 | Massachusetts | $50 | $1.27 / $1 | 1 in 4.1 | $25,000,000 | 278,406 | 9/10 | |
| 9 | 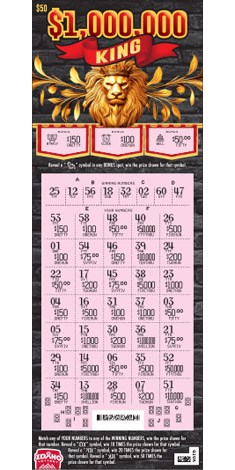 $1,000,000 King#1652 $1,000,000 King#1652 | Idaho | $50 | $1.26 / $1 | 1 in 2.87 | $1,000,000 | 35,471 | 9/10 |
| 10 | 50X#1609 | Oregon | $20 | $1.19 / $1 | 1 in 2.82 | $150,000 | 13,369 | 9/9 |

See the biggest unclaimed prizes still available →Dead tickets: games still selling with no top prize left →Overdue jackpots: top prizes that should have hit by now →
Scratch-off odds by state
- Arizona
- Arkansas
- California
- Colorado
- Connecticut
- Delaware
- District of Columbia
- Florida
- Georgia
- Idaho
- Illinois
- Indiana
- Iowa
- Kansas
- Kentucky
- Louisiana
- Maine
- Maryland
- Massachusetts
- Michigan
- Minnesota
- Mississippi
- Missouri
- Montana
- Nebraska
- New Hampshire
- New Jersey
- New Mexico
- New York
- North Carolina
- North Dakota
- Ohio
- Oklahoma
- Oregon
- Pennsylvania
- Rhode Island
- South Carolina
- South Dakota
- Tennessee
- Texas
- Vermont
- Virginia
- Washington
- West Virginia
- Wisconsin
- Wyoming

Built by Riley Johnson, an engineer in Oklahoma who read about the statistician who cracked a scratch ticket — and realized the data to measure every game is public. Nobody was reading it, so this site does, every day.
The Scratch Ledger
What Happens to Unclaimed Scratch-Off Prizes?
Millions in winning tickets go uncashed every year. Here's where that money lands, and what an expired top prize means for the tickets still on the shelf.
Top Lottery Games Editorial · 5 min readSet Your Number: A Beginner's Scratch-Off Budget
A judgment-free way to decide what you'll spend before you spend it, plus the one habit that quietly turns a $20 night into a $200 one.
Top Lottery Games Editorial · 5 min readLottery Myths, Tested: Lucky Stores and "Due" Games
Every regular has a theory about which tickets win. We ran the popular ones past the actual probability and found that three collapse and one holds up.
Top Lottery Games Editorial · 6 min readFrequently asked questions
How do you decide which scratch-off tickets are best?
We rank games by expected return — the average amount a ticket pays back per dollar spent, based on the prizes still unclaimed in that game. The higher the return, the less the game costs you on average.
How often is the data updated?
Every day. We pull per-tier prize data from official state lottery websites and recalculate each game's expected return, because a game's value changes as prizes are claimed.
Does a higher-ranked ticket mean I'll win?
No. Almost every scratch-off has a negative expected return, meaning the average player loses money. A higher ranking means a game loses you less on average — not that it is profitable. Play for fun, not for income.
Are you affiliated with the lottery?
No. Top Lottery Games is independent and not affiliated with, endorsed by, or operated by any state lottery. All data comes from publicly available official lottery sources.